One way out, or six that fill too slowly
California asks its towns to count their evacuation routes. I measured what those routes can carry, and where they run through fire.
Fire times from NIST's reconstruction (Technical Note 2135). Evacuation times from this study; the managed range reflects missing lane counts on rural roads.
Why a road map is a fire map
I have been drifting for a while toward the place where two things I like meet: network theory, which is about what holds a system together, and spatial data, which is about where things actually are. Most network science works on graphs that float free of the ground. Most planning work knows exactly where the ground is and treats the network as a list of roads. I wanted one project that would do both honestly, and that would be useful to a planner as well as interesting to a network scientist.
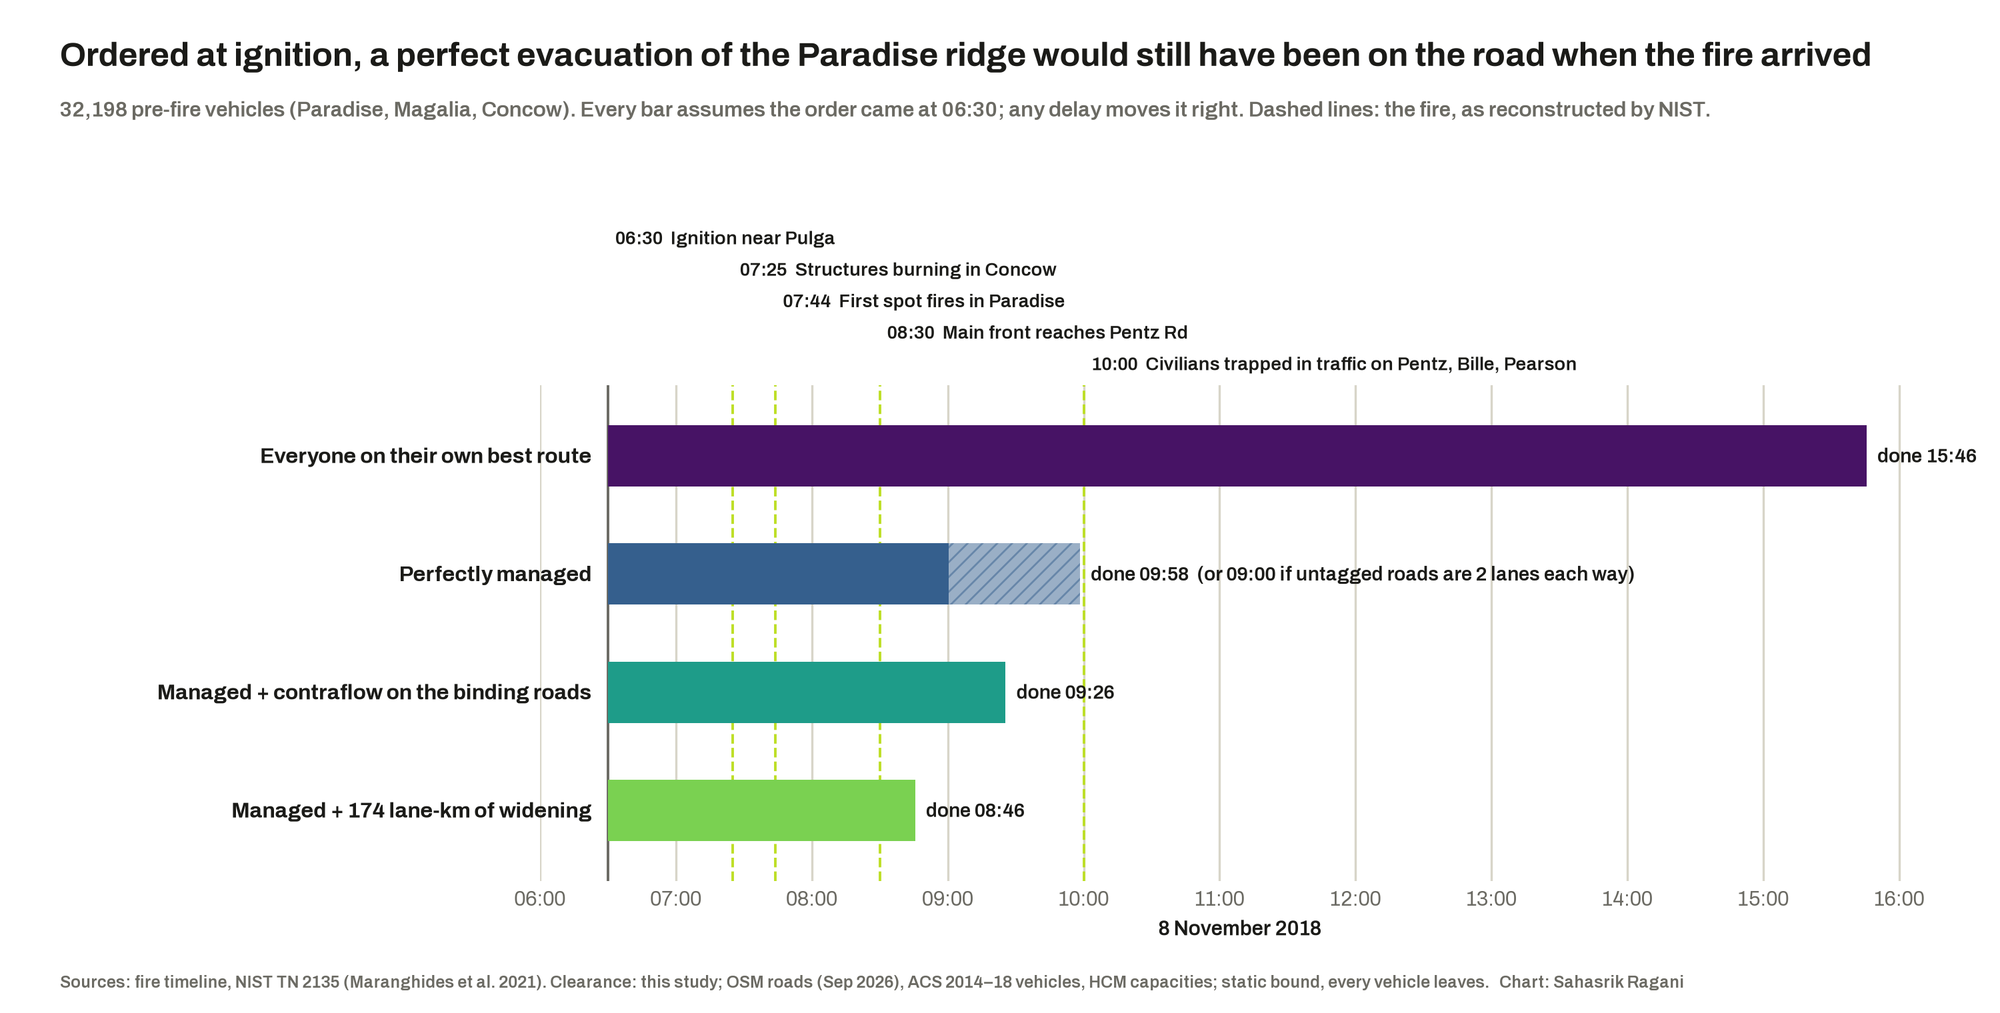
Wildfire evacuation is the case where the two cannot be separated. A town's road network is a graph with a capacity on every edge; a fire is a spatial event that deletes edges, and the people on the graph have hours, sometimes less, to get off it. The Camp Fire is the reference case for why this matters. On 8 November 2018 it reached Paradise, California, within about an hour and a quarter of starting, and by ten that morning, in the words of the federal reconstruction, people were "stuck in traffic and trapped in their vehicles" on Pentz Road. At least eighty-five people died.
California's response was sensible on paper. Since 2019, Senate Bill 99 has required every city and county to identify residential areas in hazard zones that lack at least two evacuation routes, and AB 747 asks them to assess route capacity. What I noticed, reading those laws next to the Camp Fire, is that Paradise would have passed the first test. It had six routes out. So the question I set myself was sharper than "who has one way out": which communities have too little road capacity for the people behind it, how much of that capacity runs through land CAL FIRE rates as Very High fire hazard, and what could actually be done about it?
The project works at two scales. Part A takes the whole California road network as pure topology (about two million junctions) and asks how it comes apart when junctions are lost. Part B puts the roads back on the ground for two places: Butte County, where Paradise is, and the two Los Angeles areas that burned in January 2025, around the Palisades and Altadena. It is a planning, network-science and GIS project; the hazard maps and fire perimeters it uses are themselves built partly from imagery, but no imagery is analysed directly here (that is the next step, below).
What I expected before running anything
These were written into the design document before any result existed, so they can be held against what came back.
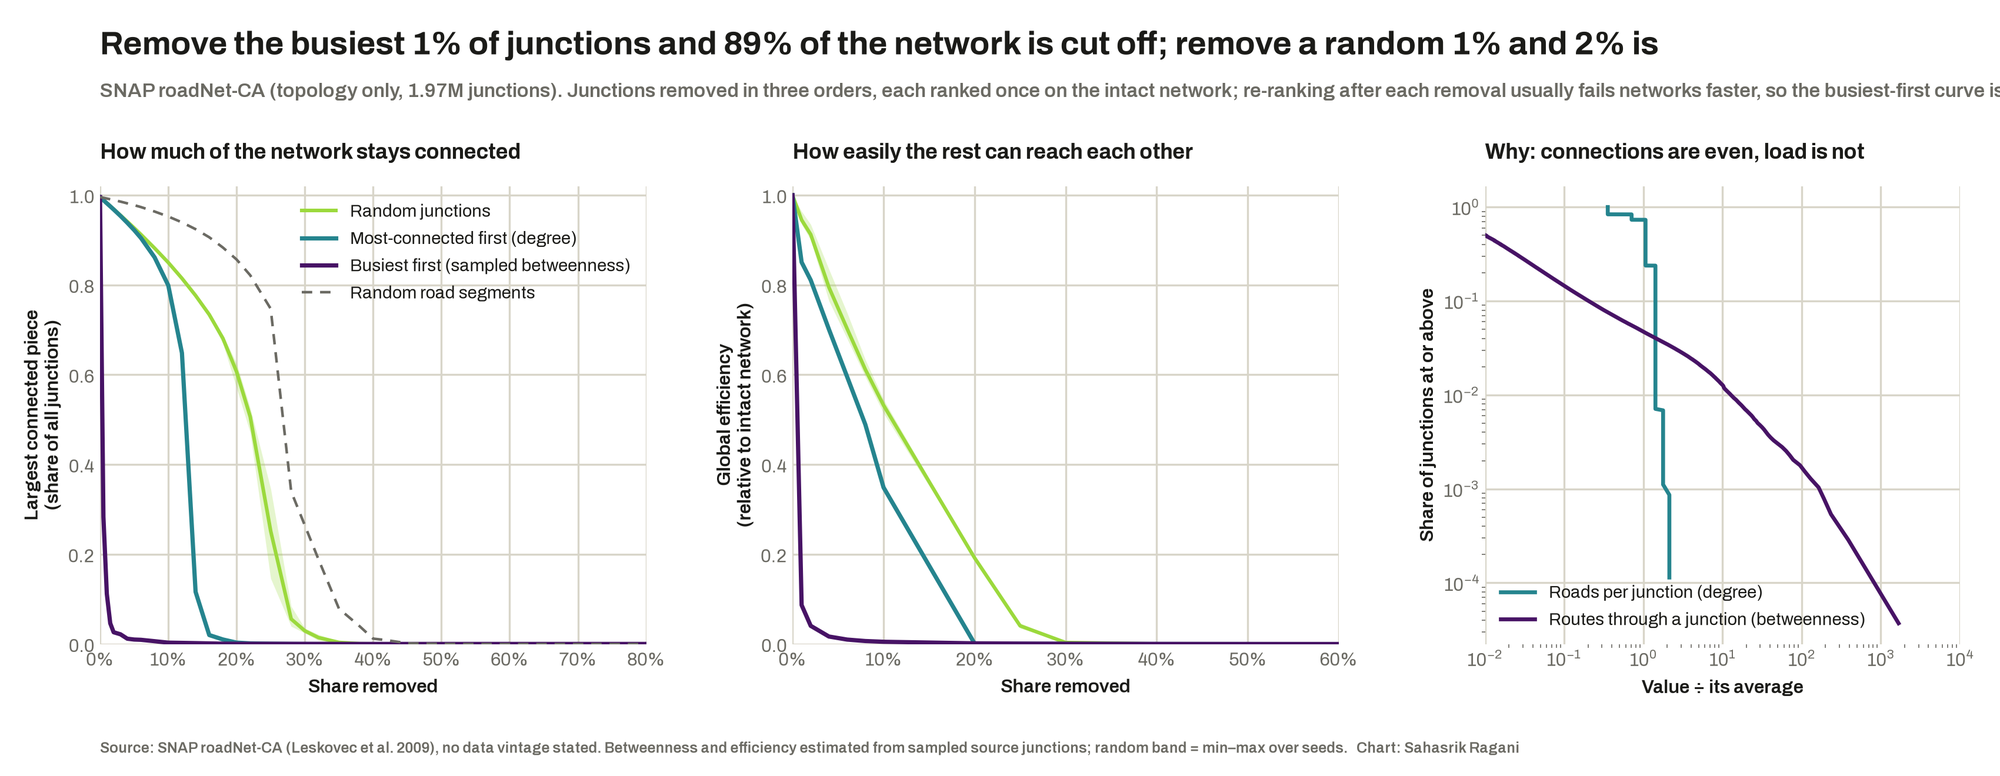
Road networks shrug off random damage and collapse when their busiest junctions go, because their connections are even but their traffic is not.
Removing the busiest 1% of junctions cut 89% of the network off from its main piece; a random 1% cut off 2%. The top 1% of junctions carry 83% of the shortest-path load.
Removing the most-connected junctions would look almost the same as removing random ones.
True up to about 10% removed; by 20% the most-connected order had collapsed the network while random removal left 61% connected.
Paradise would not show up as a one-exit town; its problem would be capacity, so a count of routes would call it safe.
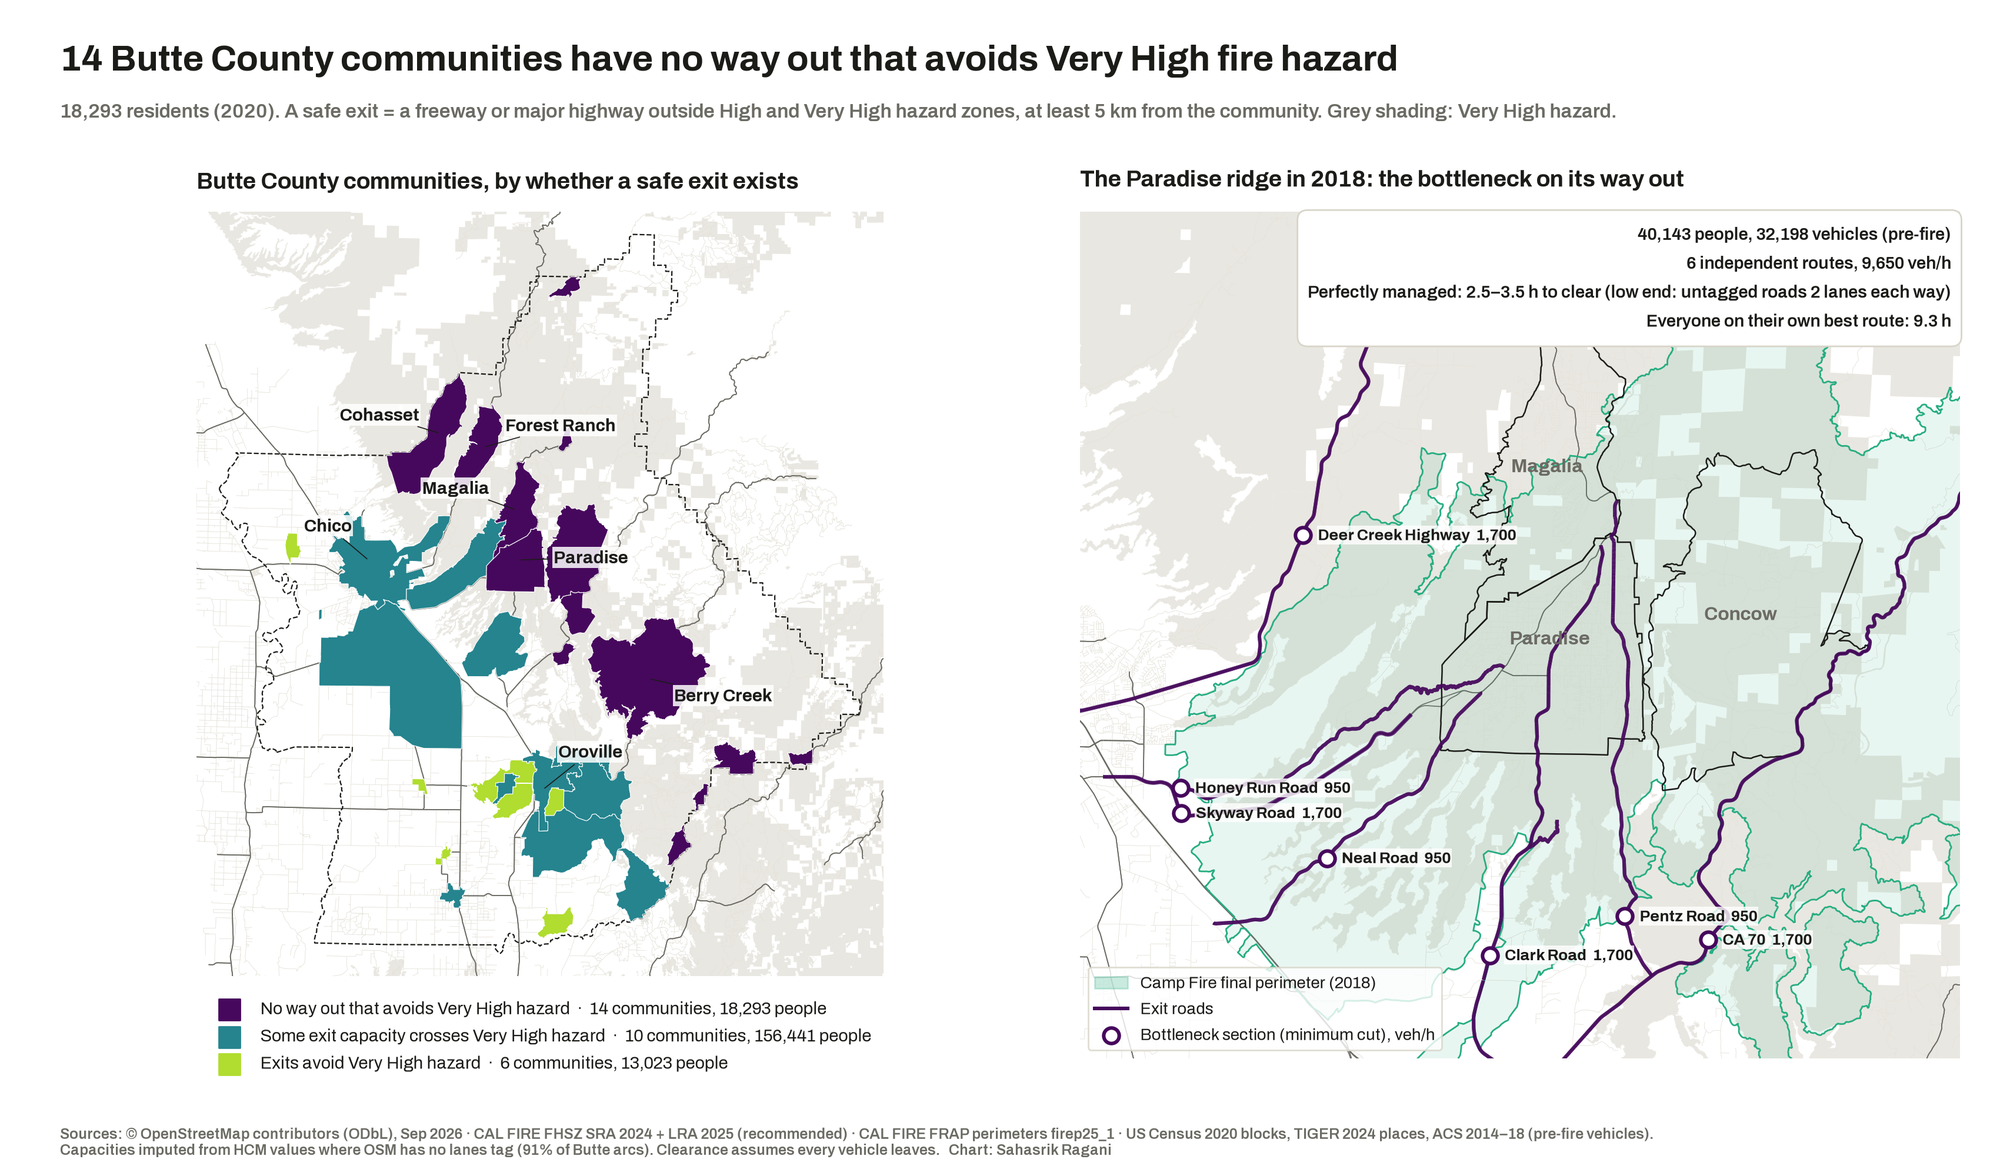
The model found six independent routes and, without being told, the roads they run on: Skyway, Clark, Pentz, Neal, Honey Run, Highway 32 and the Feather River canyon road.
Drivers each taking their own best route would carry far less than a coordinated evacuation could (a Crucitti–Latora–Marchiori-style congestion model).
Self-routing took a median of 3.0× the managed time across Butte communities and 5.2× across the LA areas. The size of the gap depends on the model; its direction does not.
The network comes apart at its busiest points
Part A treats California's roads as a graph of about two million junctions and removes them in three orders: at random, most-connected first, and busiest first (by how many shortest paths run through each). The random curve bends slowly; the busiest-first curve falls off a cliff at the first percent. The efficiency panel shows something the connectivity panel hides: road networks rarely split apart, they force detours, and efficiency falls much faster than the share of junctions still connected.
14 Butte communities have no way out that avoids Very High hazard
Part B asks, for every community, how many independent routes reach a safe destination (a freeway or major highway outside the High and Very High zones, at least five kilometres away), how many vehicles an hour those routes can carry, and what is left when the roads through Very High land are closed. In Butte County, 14 of 30 communities, home to 18,293 people, have no hazard-free route at all.
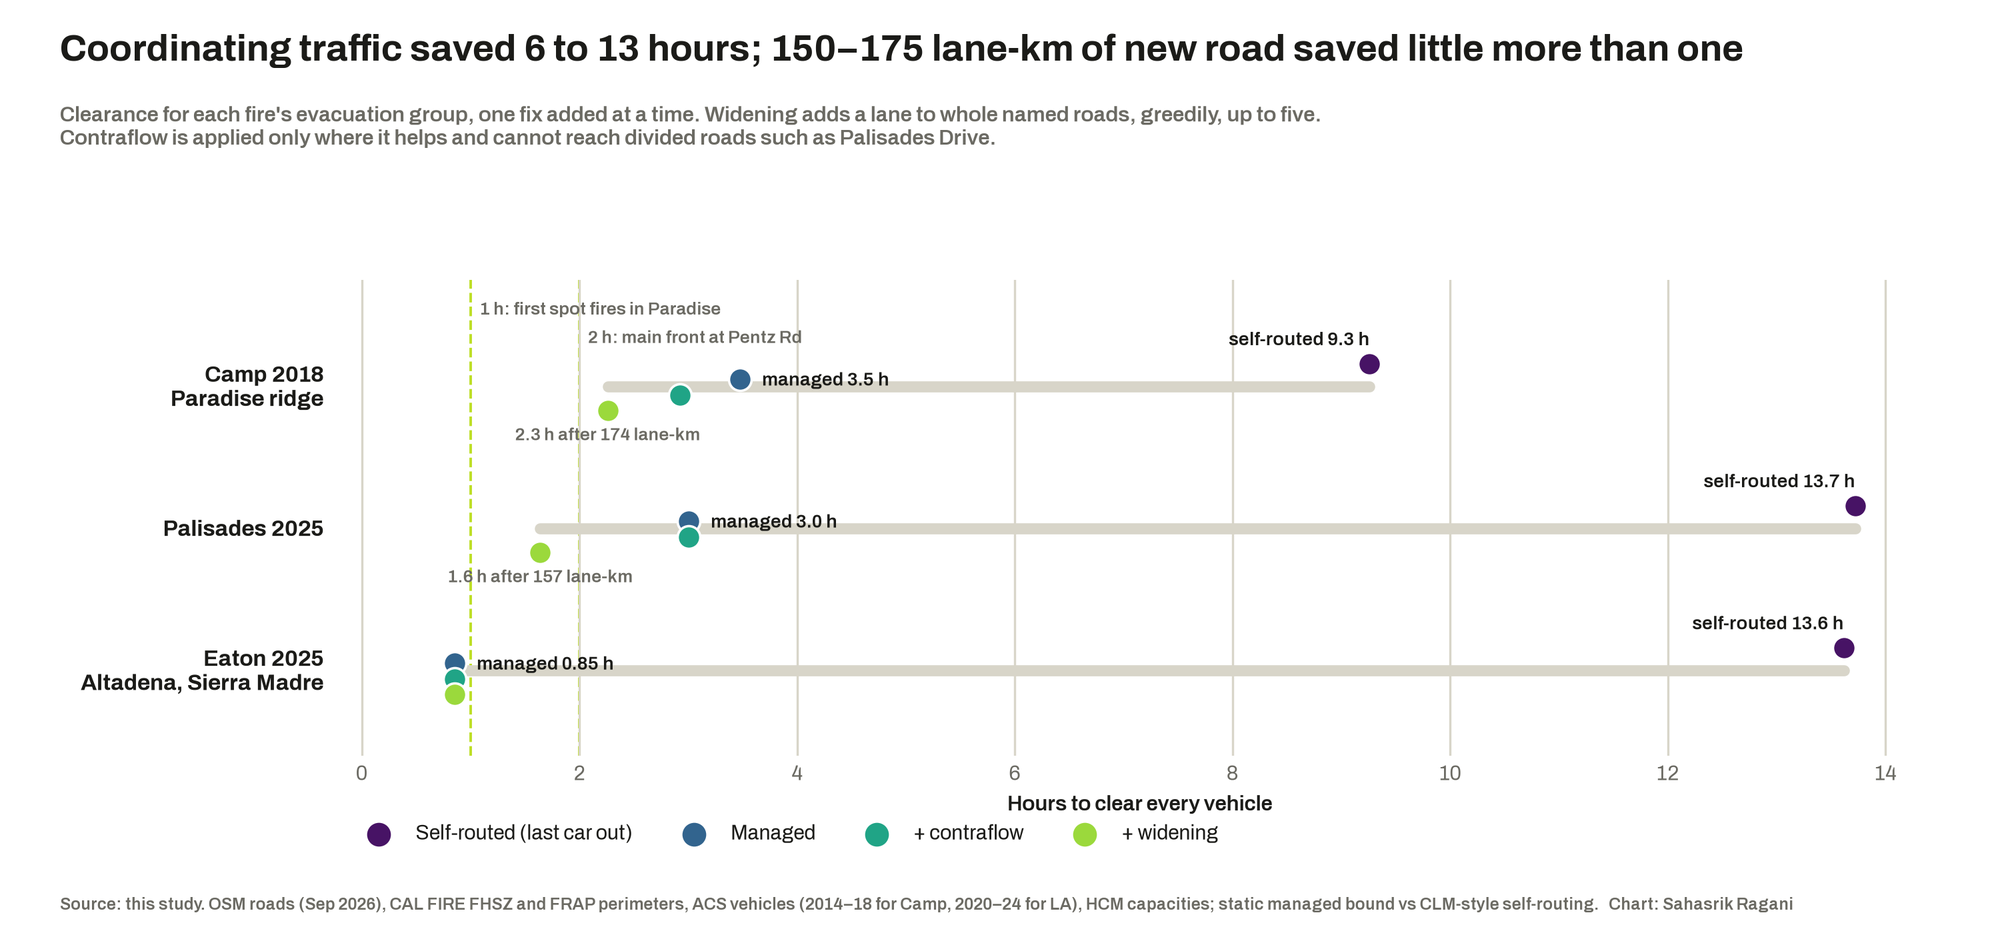
The Camp Fire is the check on whether any of this is real. Run as one evacuation (Paradise, Magalia and Concow left together, and counting them separately would count the same exits twice), the ridge's bottleneck lands on the roads named in every account of that morning. Its 32,198 pre-fire vehicles needed 2.5 to 3.5 hours to clear even if perfectly managed, and 9.3 if every driver took their own best route.
Two Los Angeles fires failed in different ways
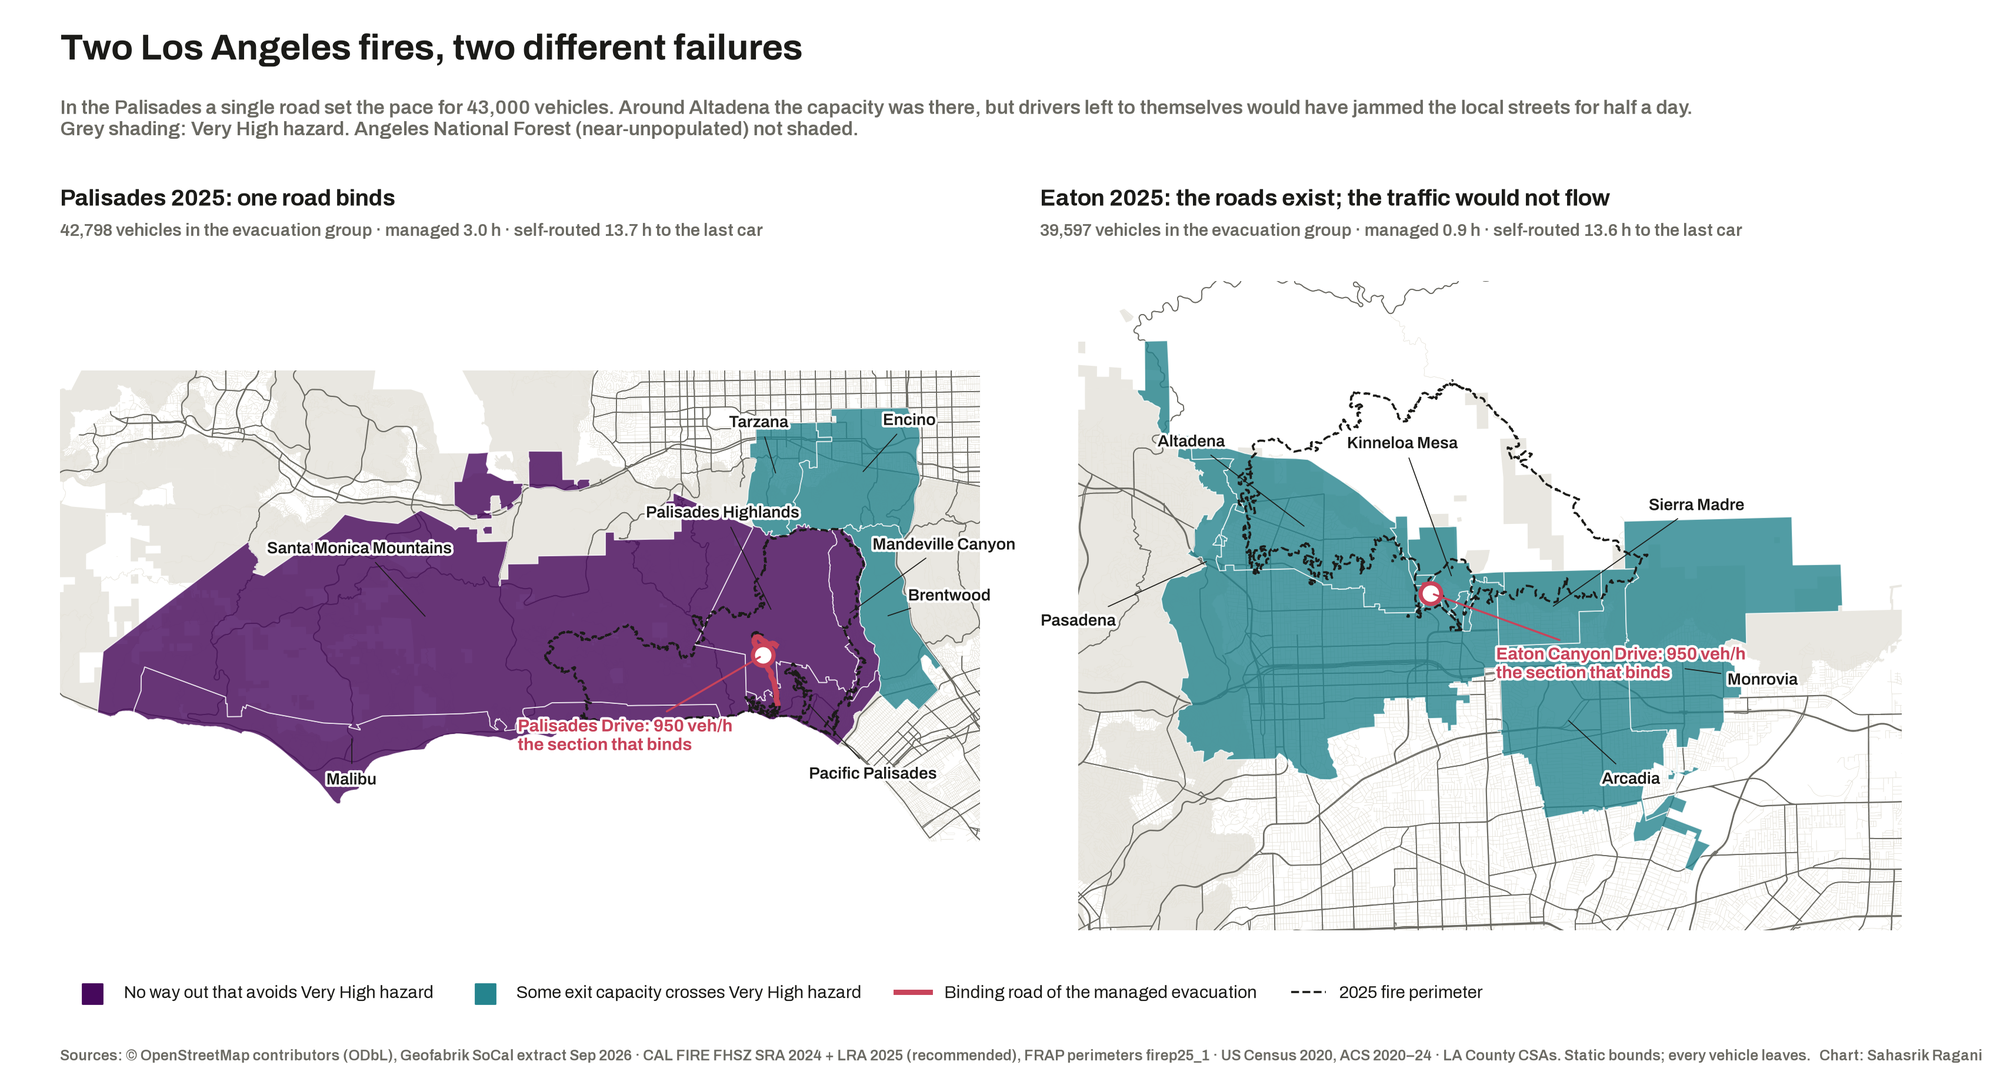
The Palisades and Eaton fires of January 2025 give two very different cases. Every community in the Palisades cluster (56,841 people) has no way out that avoids Very High hazard, and its evacuation is capped by one road: Palisades Drive, the way down from the Palisades Highlands, at about 950 vehicles an hour. Around Altadena the capacity exists; a managed evacuation clears in under an hour. Left to self-routing, the model sends almost everyone toward one freeway terminus and down a handful of local streets, and the last car is out after 13.6 hours.
The same label hides three different problems
"No safe way out" sounds like one condition. The three fires say otherwise, and the difference is what decides the price of fixing it.
Eaton 2025: operations
13.6 h self-routed
The roads were there. Phased orders and traffic control are close to free.
Camp 2018: both
9.3 h self-routed
Too little capacity and a large coordination loss, at the same time.
Palisades 2025: structure
13.7 h self-routed
One road binds. No amount of management widens a single road.
A ladder, not a pass mark
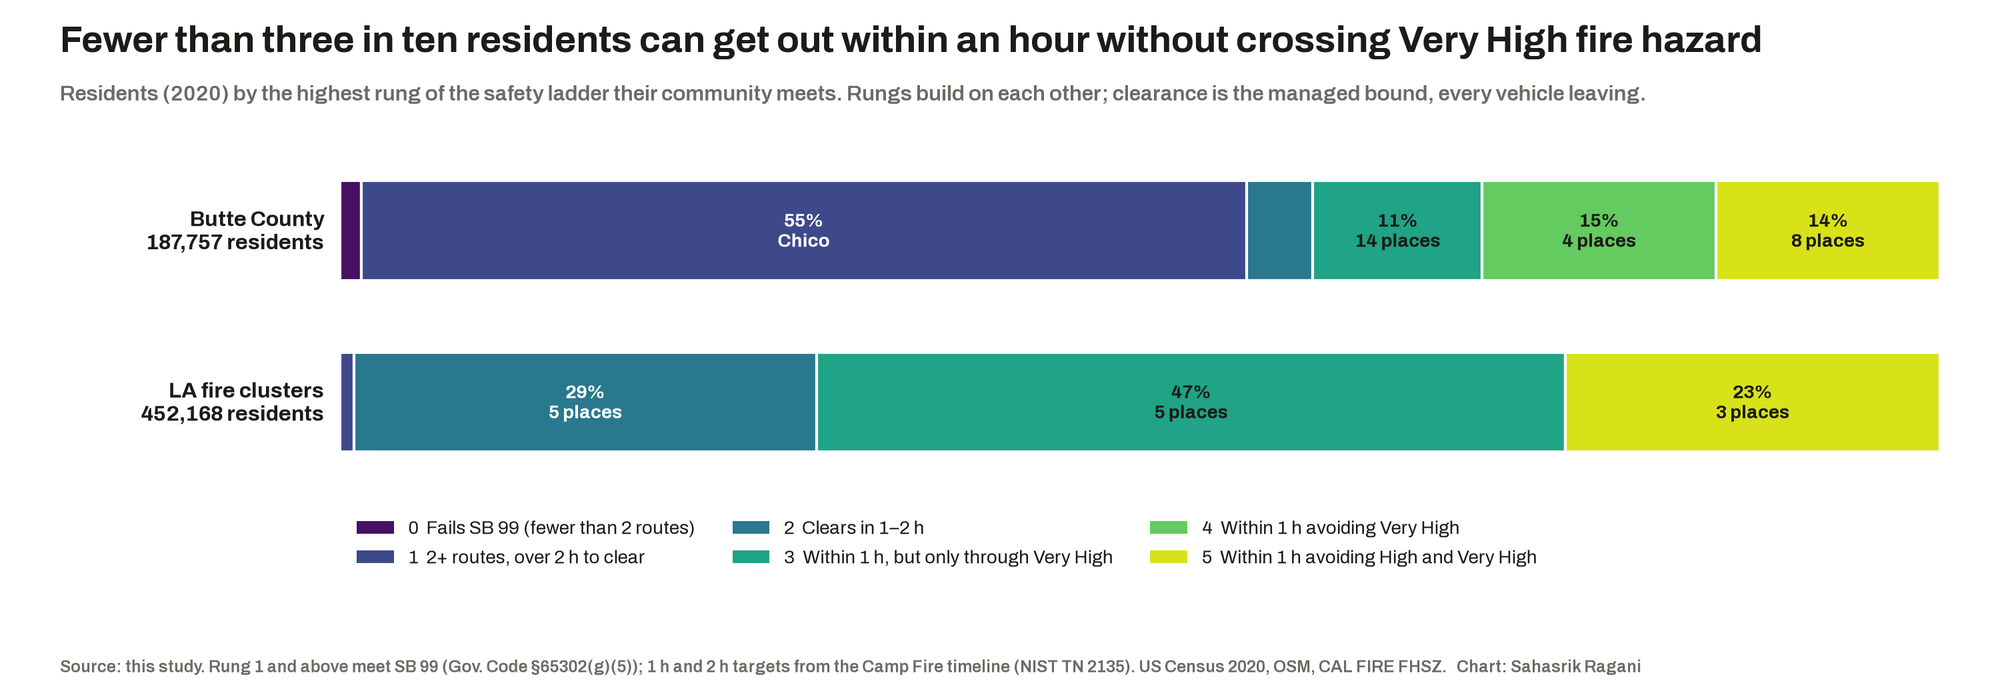
Because SB 99's two-route test would have certified Paradise, I replaced it with a ladder. The bottom rung is SB 99 itself; the next two ask whether a community can empty in two hours (the time the Camp Fire's main front took to reach Pentz Road) and in one (the time its first spot fires took); the top two ask whether it can do that without driving through Very High, and then High, hazard. No California agency has set a clearance target that I could find, so these come from the Camp Fire's own timeline. Fewer than three residents in ten, across both study areas, can get out within an hour without crossing Very High hazard.
What each fix buys
For each fire's evacuation group I added one fix at a time: running the evacuation instead of leaving it to drivers, reversing inbound lanes on the roads that bind (contraflow), and adding a lane to whole named roads, greedily, up to five times. Coordination saved between six and thirteen hours per fire. Between 150 and 175 lane-kilometres of widening saved little more than one. On the Paradise ridge, even 174 lane-kilometres leave the evacuation at 2.3 hours, still short of the two-hour rung at its 2018 population. Opening the fire roads (the unpaved tracks and gated service roads that no normal road map counts) would carry Berry Creek and Cohasset over SB 99's two-route line, but gives none of Butte's cut-off communities an exit that avoids Very High hazard; the fire roads run through the same forest.
What this adds
- A capacity test to set beside SB 99. A reproducible audit that asks what a community's routes can carry and what they run through, not only how many there are, and that agreed with Butte County's own evacuation-constraint map on where the problem sits (while working community by community, where the county works parcel by parcel).
- The road that actually binds. The plain minimum cut for the Palisades group sat far from the fire and hid the problem. Cutting the demand-weighted problem instead, with traffic starting where the vehicles are, names Palisades Drive. That is the version a planner can act on.
- Coordination loss with real capacities. An adaptation of the Crucitti–Latora–Marchiori cascade model with physical road capacity in place of an abstract tolerance, and a like-for-like managed bound, reported as a range because a static model cannot say which reading an evacuation follows.
- A check on how road graphs are built. Two standard California road graphs disagree about random fragility; about half of that disagreement is shape points counted as junctions. Only the busiest-first result survives every version of the graph.
- An engine that is not about California. Nothing in the
hazardnetpackage knows about fire or the state. The next project runs it on Ahmedabad with a flood-depth raster instead.
Suggestions
Run the evacuation before building the road. Phased orders by zone, officers at the intersections the model names, and signal timing for outbound traffic buy more time than any widening I tested, for a fraction of the cost. Build where one road binds, and only there: a second way down for the Palisades Highlands, and for Berry Creek and Cohasset in Butte, the two communities that fail even SB 99. Treat fire-road access as a way to meet SB 99's letter, not its purpose. And for ridges like Paradise, where the doors cannot empty the room in time at any realistic price, the conversation has to move to what a building code already does for a theatre: earlier, forecast-triggered orders, designated refuge areas, and a limit on how many more homes a ridge with six exits should take. My thoughts on that last one are still developing; it is easy to write "occupancy limit" and much harder to say whose home it applies to.
On the research side, the next step is the one this project stops short of: measuring from Sentinel-2 imagery how badly the corridors along each binding road actually burned, to set the modelled hazard map against the observed fire. After that, a time-varying simulation, a statewide run, and Ahmedabad.
Limits that belong with the findings
Every clearance time is a static bound: every vehicle leaves, demand shares are fixed, and the fire is represented by its final perimeter rather than its hour-by-hour spread. Lane counts are missing for 91% of Butte's road segments, which is why the Paradise figure is a range. Population is 2020 residents, and Paradise's population fell by more than four-fifths after the fire, so the Camp check uses pre-fire vehicle counts instead. The 2025 local hazard map for Los Angeles is still "recommended" rather than adopted everywhere. The self-routed figures come from a congestion model and should be read as indicating the size of the coordination problem, not as a forecast.
Roads: © OpenStreetMap contributors (ODbL), via osmnx and Geofabrik extracts, September 2026. Hazard: CAL FIRE Fire Hazard Severity Zones, State Responsibility Area (effective 2024) and Local Responsibility Area (recommended 2025). Fire perimeters: CAL FIRE FRAP, release firep25_1. Population and vehicles: US Census 2020 blocks; American Community Survey 2014–18 and 2020–24. Graphs: SNAP roadNet-CA (Leskovec et al. 2009); 9th DIMACS Implementation Challenge. Fire timeline: Maranghides et al. (2021), A Case Study of the Camp Fire: Fire Progression Timeline, NIST TN 2135. Cascade model: Crucitti, Latora and Marchiori (2004), Physical Review E 69, 045104. Maximum occupancy: Cova (2005), Natural Hazards Review 6(3). Law: SB 99 (2019), Gov. Code §65302(g)(5); AB 747 (2019).
Method, every number and every correction along the way: FINDINGS.md. The argument in full: POLICY.md.